Metrics
Amoro provides both table-level and platform-level metrics to help users understand the runtime status of the current table.
Table metrics
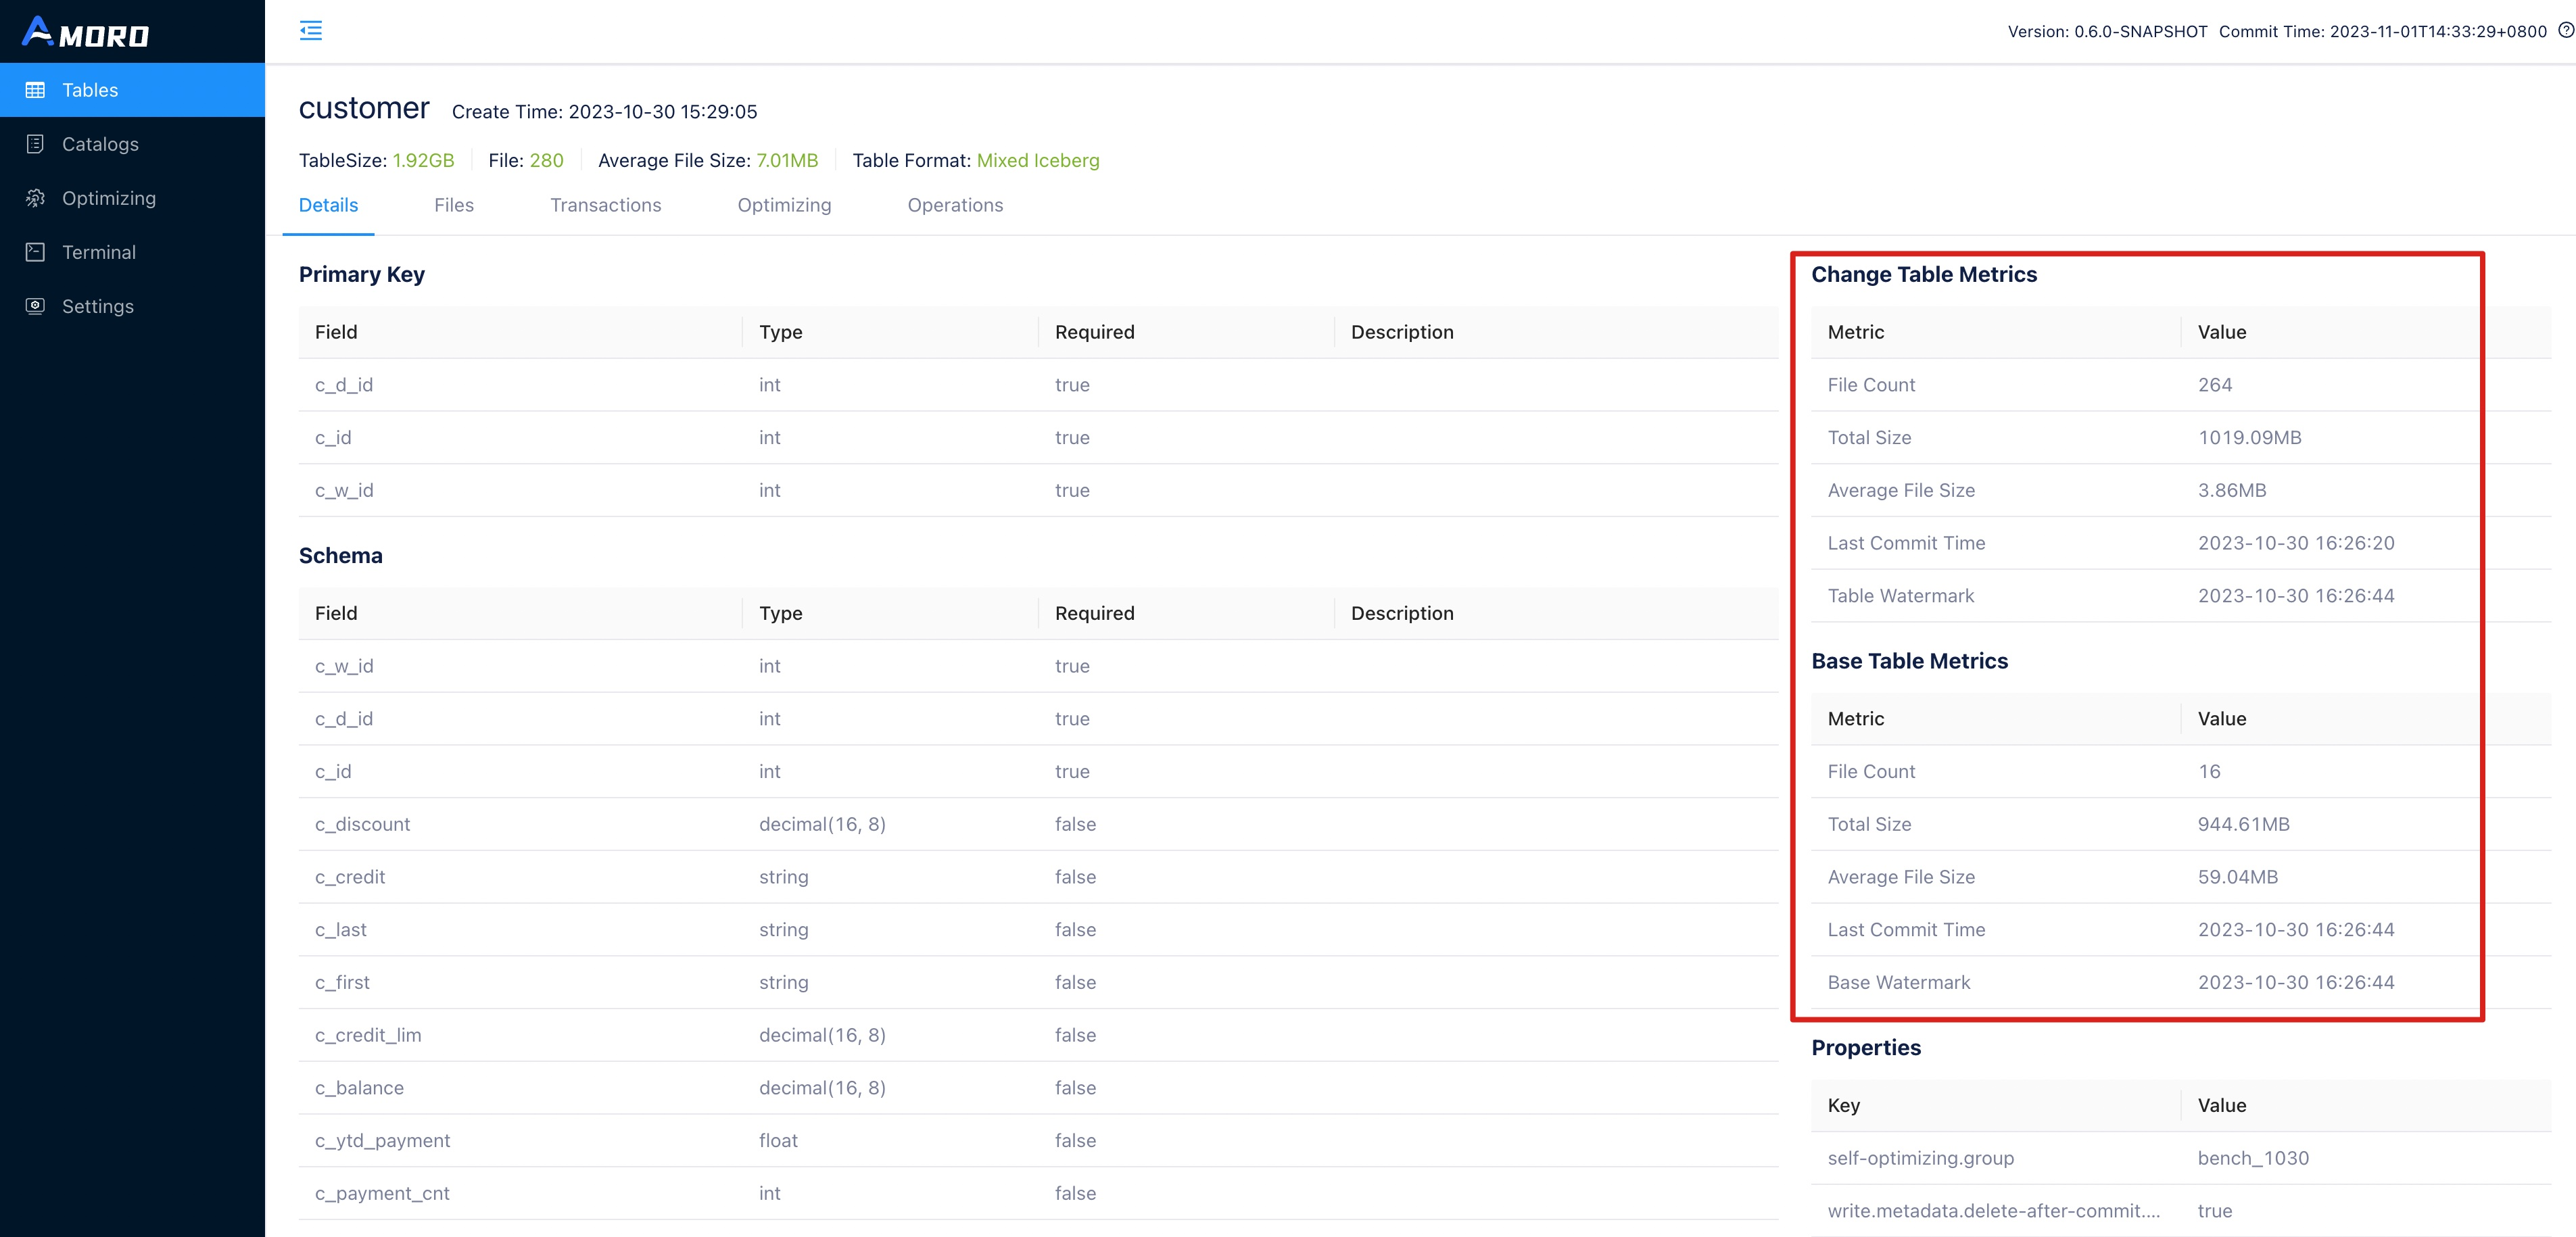
The Amoro Tables details page provides multiple tabs to display the status of the table from various dimensions, mainly including:
| Tab Name | Description |
|---|---|
| Details | Display the table’s schema, primary key configuration, partition configuration, properties; as well as the metric information of the files stored in ChangeStore and BaseStore, including the number of files and average file size, as well as the latest submission time of the files. |
| Transactions | The displayed transaction list does not include snapshots generated by Self-optimizing. |
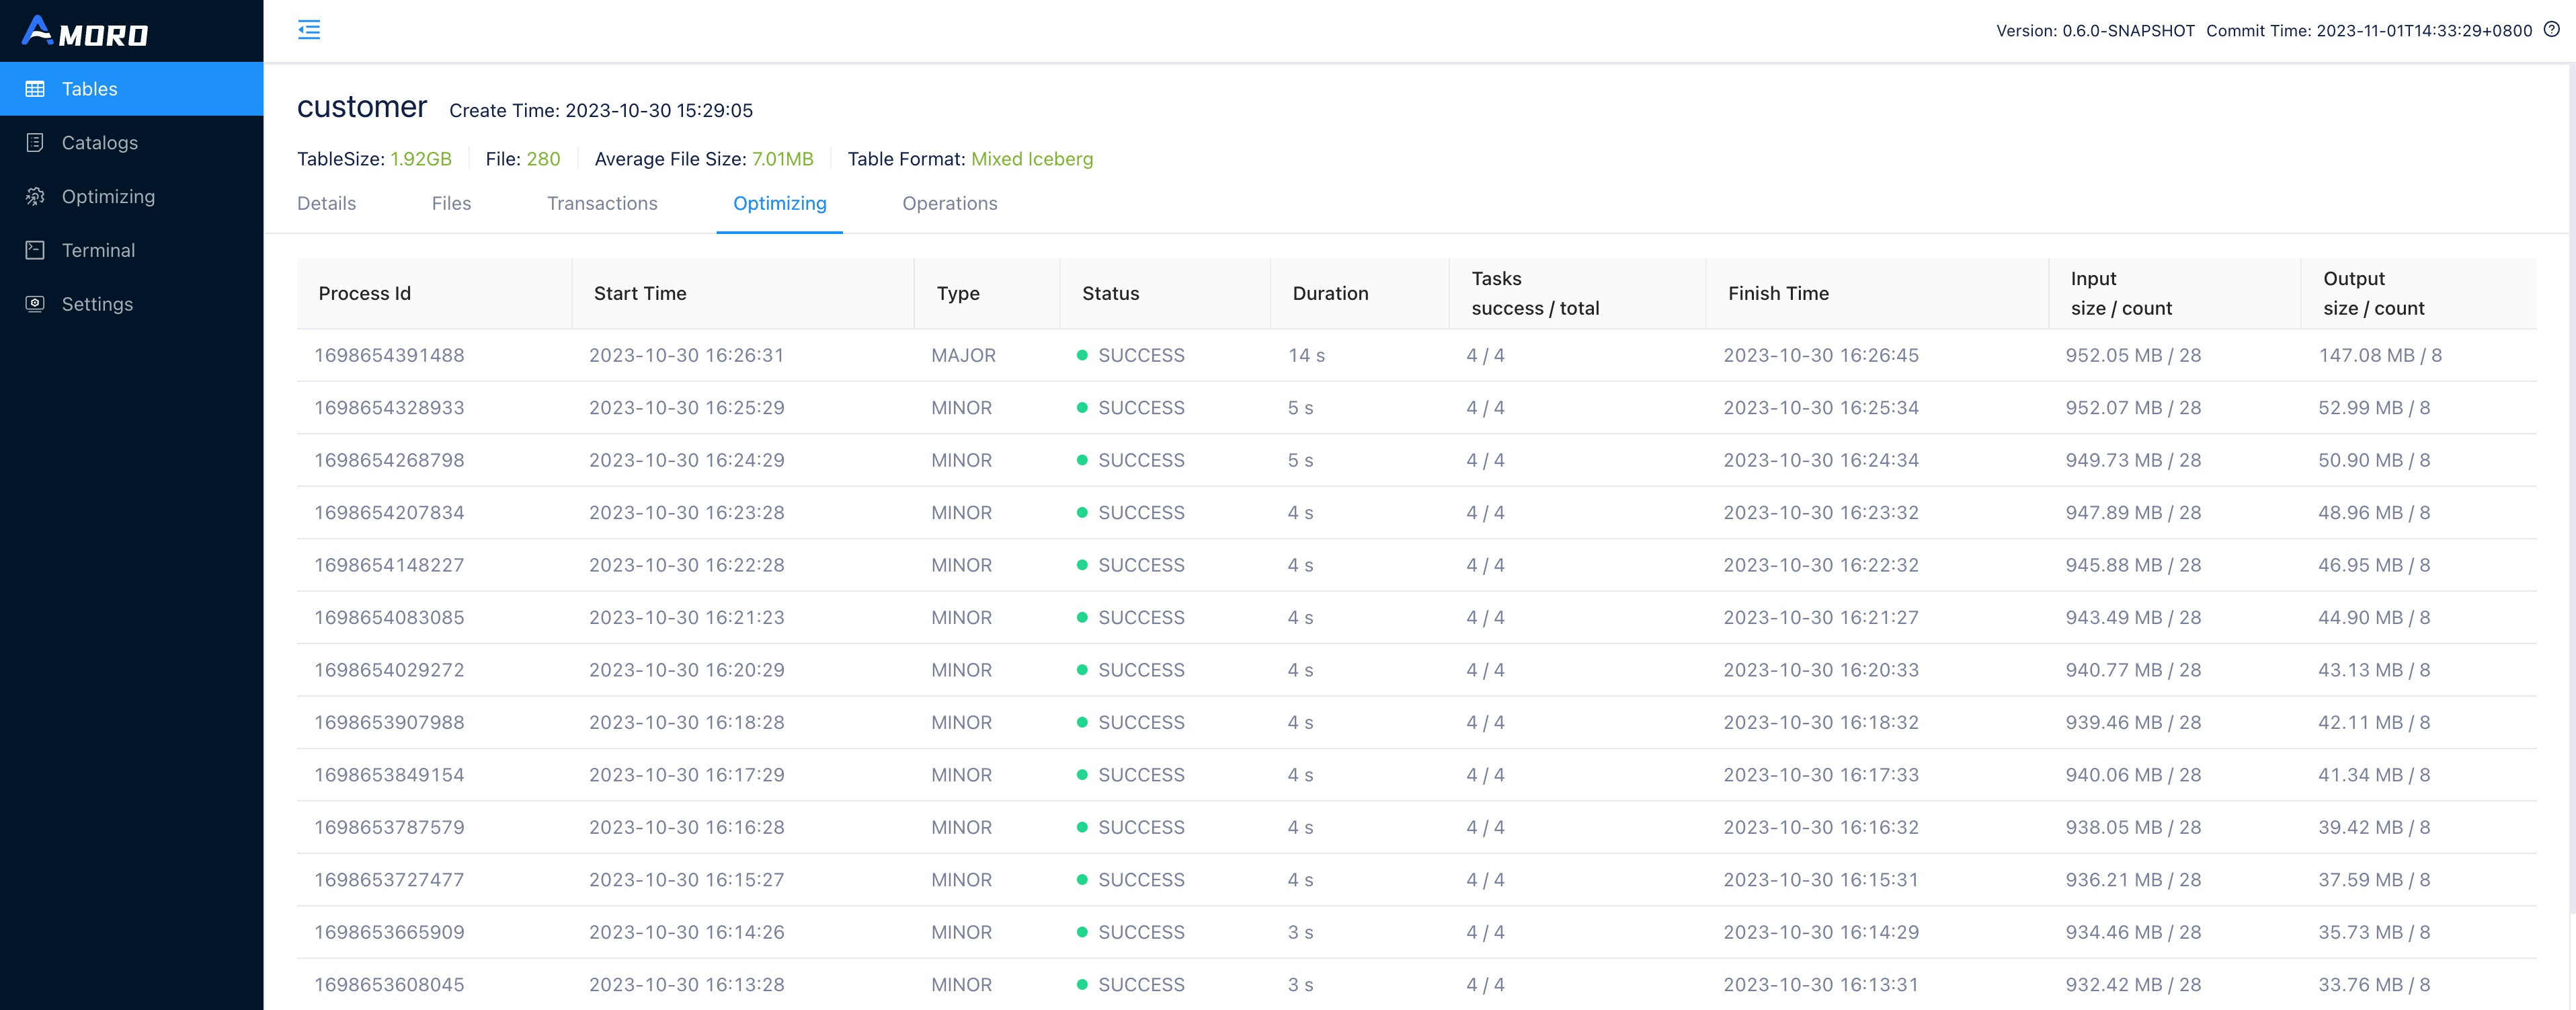
| Optimized | Display all the historical Optimize records of the table, each record shows the number and average size of files before and after Optimize, as well as the execution time of each Optimize. |
| Operations | Display the current table’s DDL historical change records. |
Self-optimizing metrics
The Optimizers page displays platform-level Self-optimizing information, including the total amount and usage of resources under different groups, as well as the status and resource usage of all tables that have executed Self-optimizing under the group.
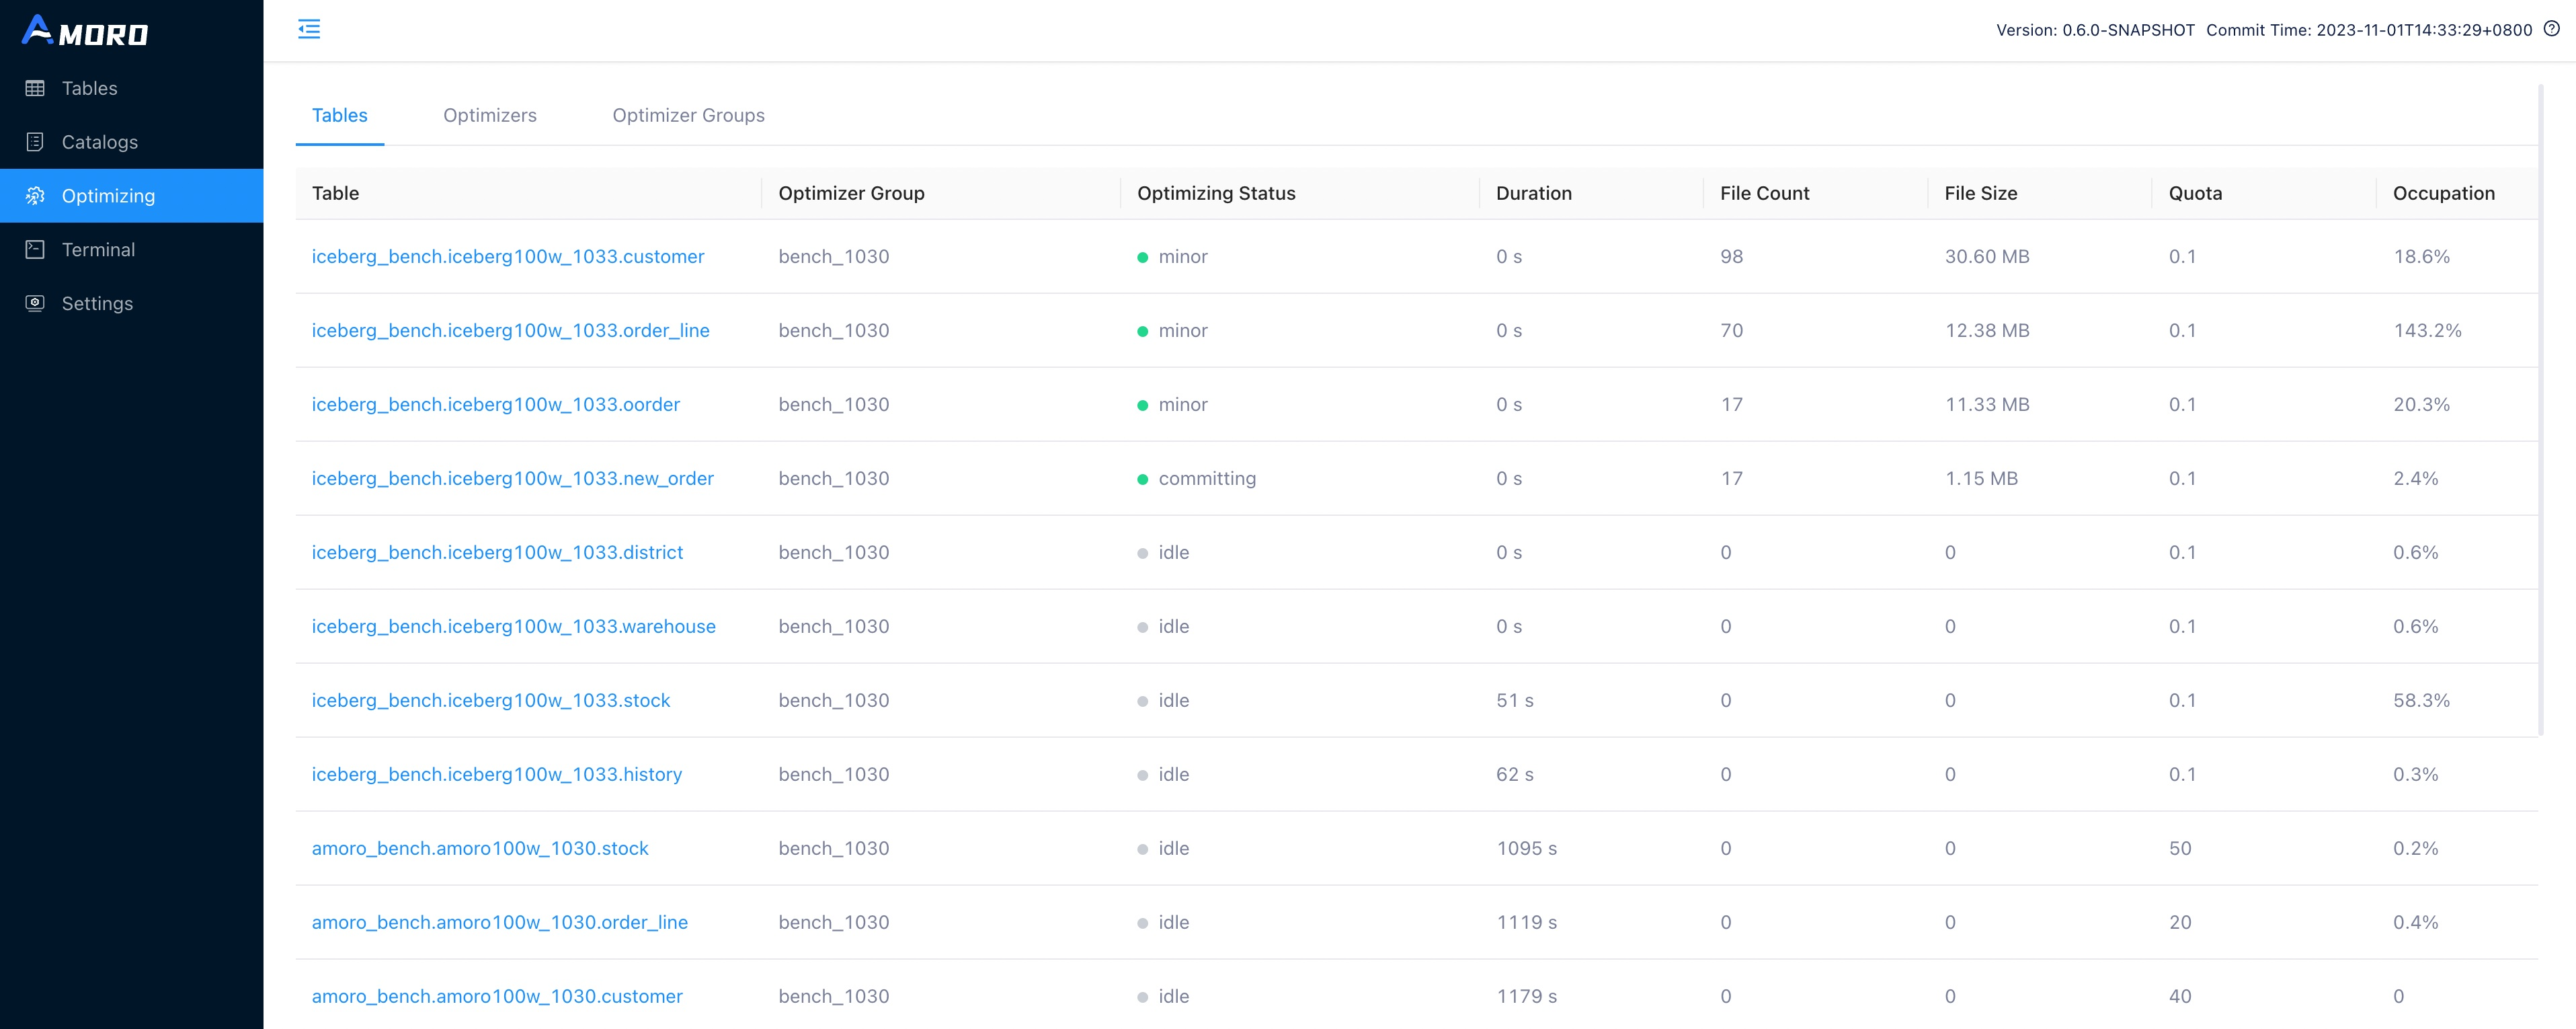
- Optimizing Status: The current optimizing status of the table, including minor, major, full, idle, and pending.
- Duration: The duration of the current status.
- File Count: The total number of files involved in the current Self-optimizing, including base, insert, eq-delete, and pos-delete file types.
- File Size: The total size of files involved in the current Self-optimizing.
- Quota: The proportion of self-optimizing execution time executed per unit time.
- Quota Occupation: The actual Quota used for self-optimizing during execution of the table in the last hour. When optimizer resources are sufficient and the table requires more resources for self-optimizing, this value will be greater than 100%. When resources are scarce or the table requires fewer resources for self-optimizing, this value will be less than 100%.